
MIT Data Communication Salon
Where Technical Thinking Meets the Art of Expression
A mind-blowing session breaking the "curse of knowledge." On 2025 / 6 / 14, at Chang'an Club's 9th-floor conference room, professionals from tech, finance, and research joined MIT Sloan School senior lecturer Miro Kazakoff for an in-depth discussion on "data communication." Dubbed by attendees as a salon that "shatters workplace communication assumptions," this all-English interactive event unpacked the root causes behind why experts often struggle to explain clearly—covering everything from how the brain processes information to practical PPT design strategies.

Key Takeaways: From Cognitive Science to Communication in Practice
The "Encode-Decode" Dilemma in Human Information Processing
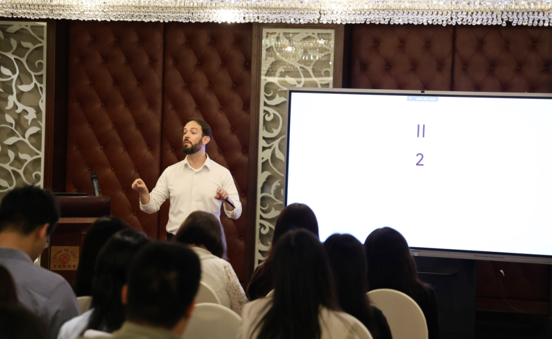
Miro demonstrated how the same information—such as "MIT logo," Arabic numerals 2, or binary code 10—is decoded very differently across individuals. He noted: "The biggest communication barrier for experts is the curse of knowledge. Once you're deeply familiar with a field, it becomes hard to imagine how someone outside that field perceives things." Audience members experienced this firsthand through the "Rose and Dolphin" optical illusion: once you know the answer, you can't unsee it.
Cognitive Energy Management: The Brain is a "Lazy Decision-Maker"
Through the "17×17" mental math experiment, Miro reveals the brain's "energy-saving mode": System 1 (intuition) handles simple tasks, while System 2 (logic) consumes significant energy. "Audiences won't think deeply unless you push them," he advises. Use one core message per slide. Demonstrate with the "MIT Red" case study: removing redundant elements (shadows, gridlines) focuses attention better than adding arrows.
The "Ink Ratio" Principle of Data Visualization
Comparing default Excel charts with optimized versions, Miro introduces the concept of "data-ink ratio": background colors, 3D effects, and irrelevant icons are all considered "non-data ink." During the hands-on session, attendees simplified a chart titled "Life Expectancy in 12 Countries Worldwide" into a black-and-white bar chart, boosting information delivery efficiency by 3 times. "Good charts make readers understand instantly, not study hard."
Immersive learning for 10-person mini workshops
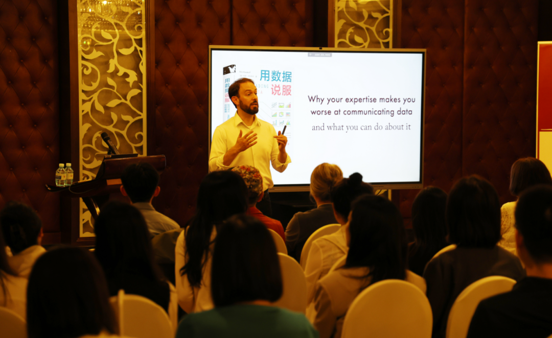
Interactive Moment: When "Pac-Man Pie Charts" Meet the "Title Revolution"
Miro displays two PPT comparisons: one labeled only "2024 Q3 Revenue," the other with a headline that hits hard: "Q3 Revenue Dropped 12% YoY, Below Industry Average." Headlines must include verbs to serve as data journalism leads. Attendees rewrote chart titles from their own work live and received one-on-one feedback from the instructor.
Q&A Session: Bridging the Gap from Research Reports to Business Presentations
Researcher: "How to explain a complex model to non-expert leaders?"
Miro: Use cognitive scaffolding—start with common analogies, then move to technical details. For example, explain neural networks by comparing them to energy-efficient lightbulbs.
Product Manager: "Should the user data dashboard be complex or simple?"
Miro: "Tailor to the scenario: retain detail during exploration, but show only decision-critical metrics in reporting. Remember: CEOs receive 100+ pieces of information daily; your charts must convince them instantly."
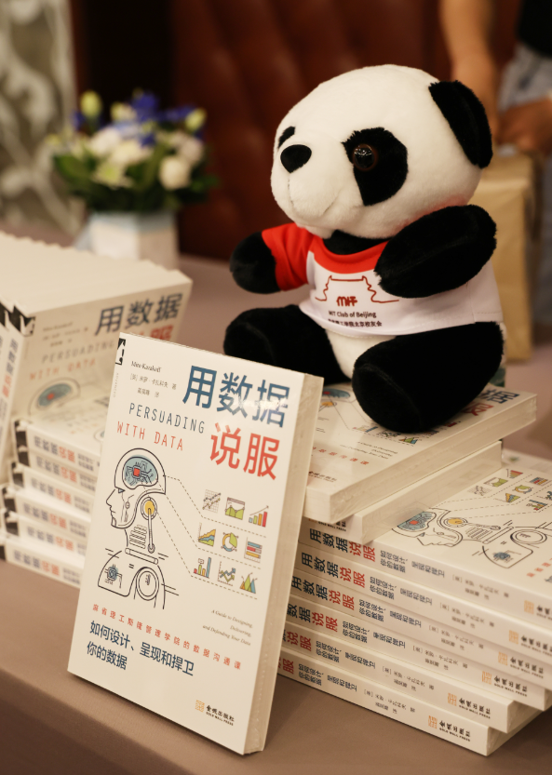
《Persuading with Data》 Book Signing Event
Participants say: "This is the most counterintuitive communication course I've ever taken."
I used to think charts looked more professional the more complex they were. Now I know that knowing what to delete requires more skill than knowing what to add.
"The Curse of Knowledge is real! My boss interrupted me 3 times last week while I was presenting a technical proposal. Turns out, the issue was my assumption that he understood the underlying logic."
Miro helped me realize: PPT titles aren't outlines—they're arguments. Updating my presentation tomorrow!
Data is cold, but communication brings the warmth that drives decisions. Join us for the next knowledge feast as we explore the boundaries of thought together.